Charts & Graphs epidemic Flu Fallout A majority of the estimated 675,000 American deaths from the influenza pandemic of 1918–19 occurred during the second wave, which swept the country throughout the fall of 1918. View
Charts & Graphs foreigners Barbarians at the Gates The outsider groups that threaten the status quo. View
Charts & Graphs youth Early Education The reading list of philosopher John Stuart Mill, ages 3–7. View
Charts & Graphs revolutions Save the Date From Bastille Day to May Day, revolutionary dates to remember. View
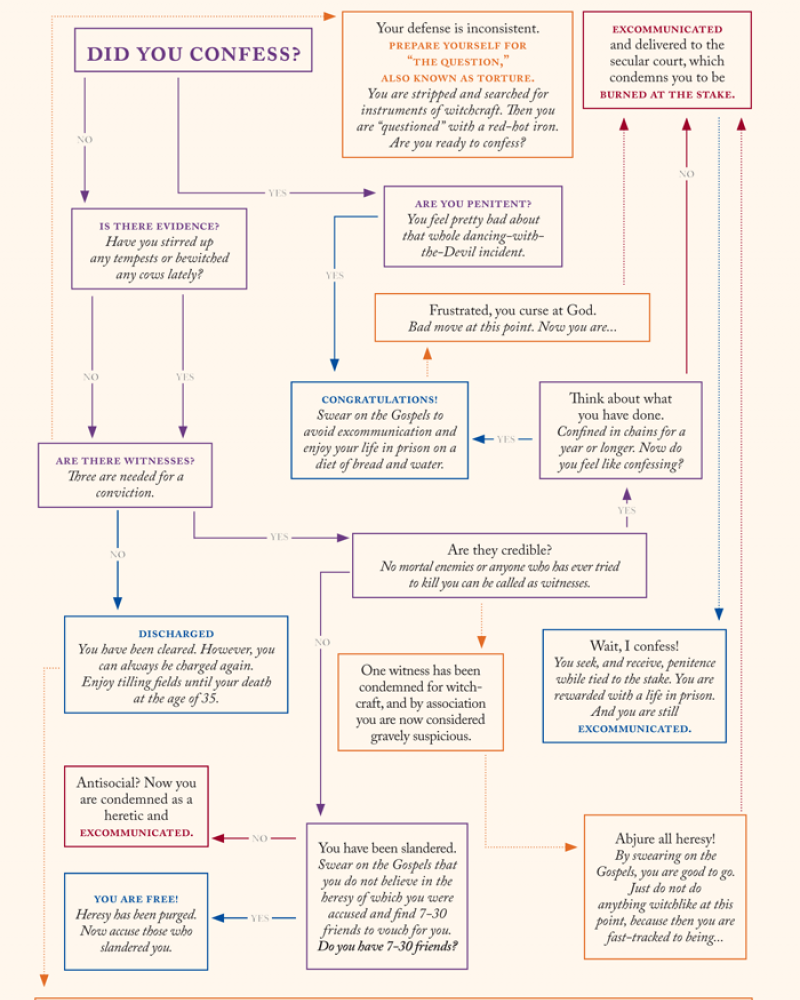
Charts & Graphs magic shows So You’ve Been Accused of Witchcraft... How to avoid the ultimate punishment. View