Charts & Graphs memory Speaking Statues “What is a statue? A living body covered with stones.”—Michel Serres View
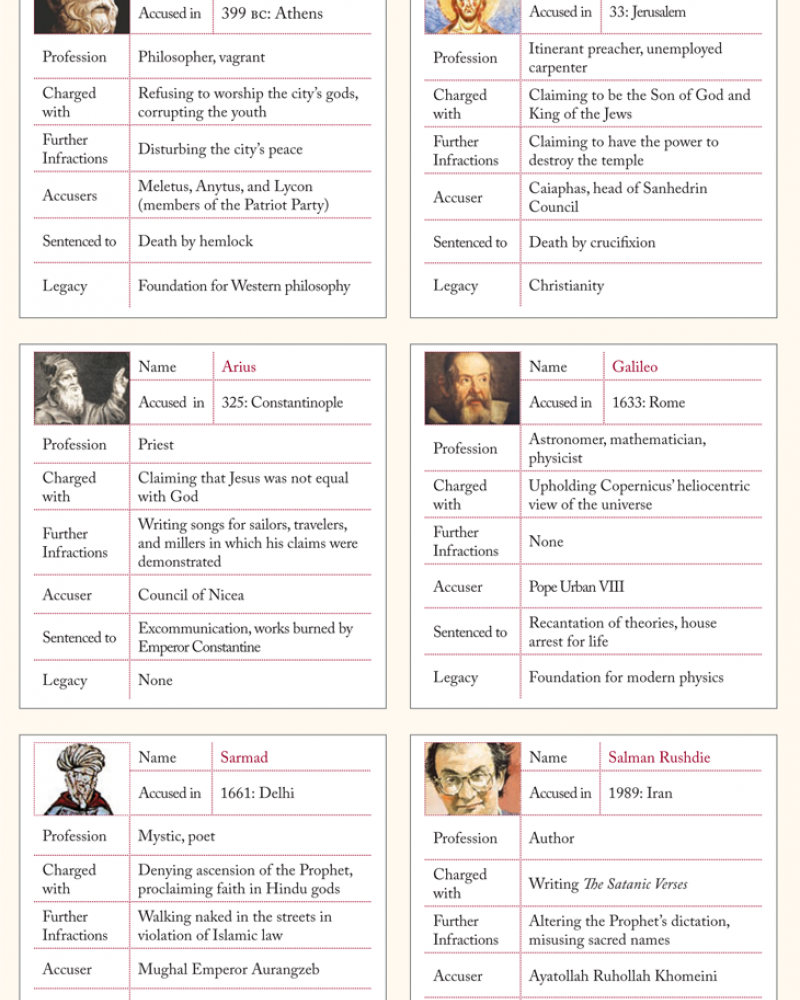
Charts & Graphs religion Heretics and Blasphemers Enraging one faith, and sometimes starting another. View
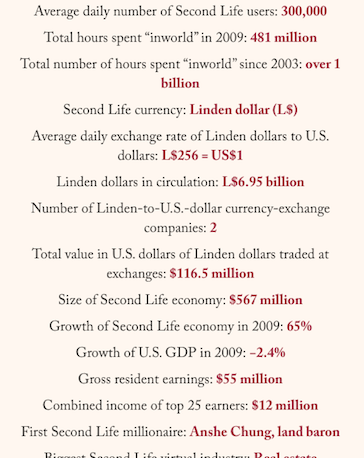
Charts & Graphs sports & games Get a Life Facts and figures about the online virtual world Second Life circa 2009. View
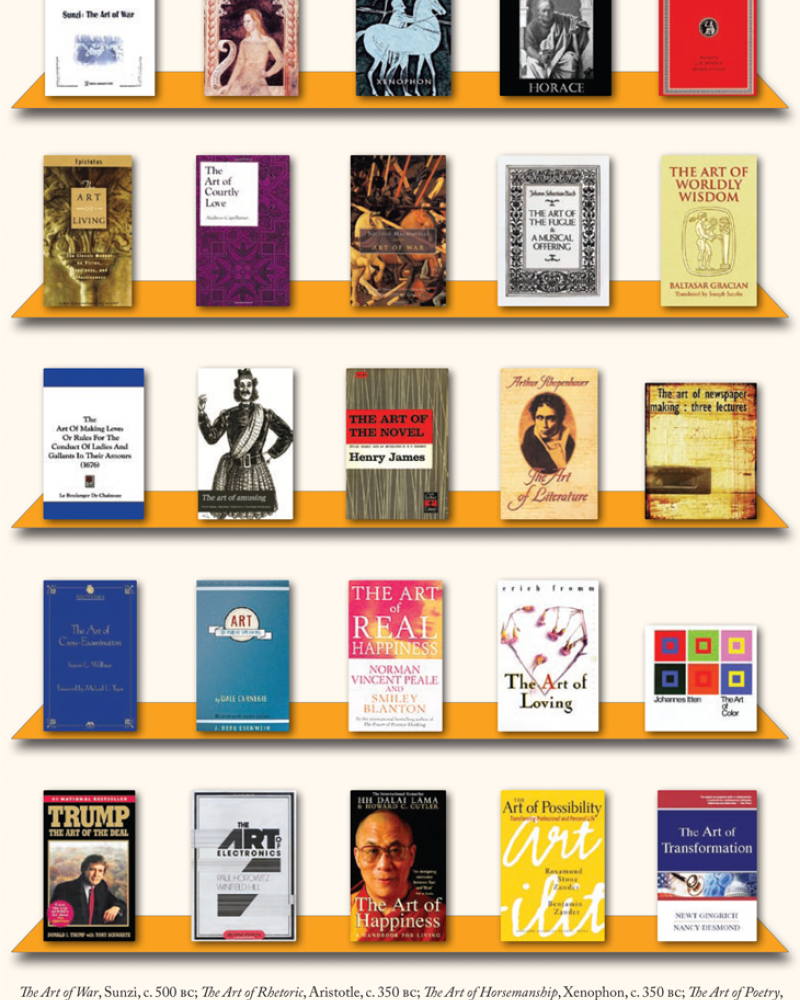
Charts & Graphs ways of learning Thought Control Books condemned by U.S. public schools during the 1980s. View